Showing posts with label Applications. Show all posts

Tuesday, September 22, 2020

Segment Value Security Rules

Introduction: Segment value security rules are setup on value sets to control access to parent or detail segment values for chart of accounts segments. Segment value security rules restrict data entry, online inquiry, and reporting. These are basically used for Non Balancing segment values security. Since we can control the access for Balancing segment values through Manage Data Access Sets.

Business case:

Data Access Sets

Ledger Name

Balancing Segment


User A

User B

US Primary Ledger

101

Comp101

Y

Y

102

Comp102

Y

N

Security Rules

Ledger Name

Cost Center


User A

User B

US Primary Ledger

110

CEO

Y

N

120

Division US

Y

N

Process:

·         Define roles for segment value security rules.

·         Enable segment value security for the value set.

·         Define the conditions.

·         Define the policies.

·         Deploy the accounting flexfield.

·         Publish the account hierarchies.

·         Assign segment value security roles to users.

Below picture illustrates steps for defining and implementing security rules for segment values.

Note: When you enable security on a value set, access to all values for that value set is denied.

Working Example: This example demonstrates how to enable security on a chart of accounts to control access to specific segment (Cost Center) values.

While creating journals by default, we are able to see all the values in cost center segment LOV. For this scenario, we need to control the access to 110 and 120.

Step 1: Create a custom job role solely for the purpose of segment value security. This role is then assigned to the users who need access. For this scenario, we created a role: VIS_General Accountant. 

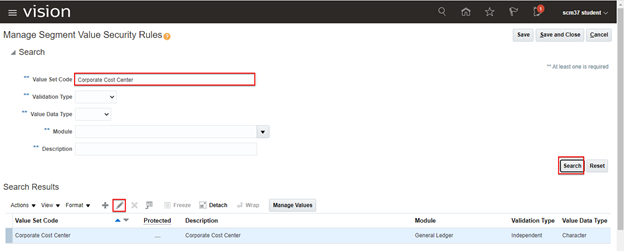
Step 2: Navigate to ‘Manage Segment Value Security Rules’ task

Use the Manage Segment Value Security Rules task to enable security on the cost center value set associated with the chart of accounts.


Step 3: Enable the Security and Enter the Data Security Resource Name.

Step 4: Click on Save and Click on Edit Data Security button.


Step 5: Create a condition for the value set. For example, the condition (CostCenter110120) for the cost center is that the value must be equal to 110 or must be equal to 120.

Select Match as Any for OR operation; All for AND operation. Click Save.


Step 6: Create a policy to associate the conditions to the roles. For example, create a policy (CorpCostCenter110120) to assign the condition CostCenter110120 to the role VIS_General Accountant Role.

Enter Role code instead of Role Name. And select fscm as Application.


Step 7: Select Multiple Values as row set and assign condition to the policy.


Click Save and close.


Click Save and Submit.


Step 8: Navigate to Manage Chart of Accounts Structures.


 Select the module and click Deploy Flexfield.


Optionally, Publish the account hierarchies.

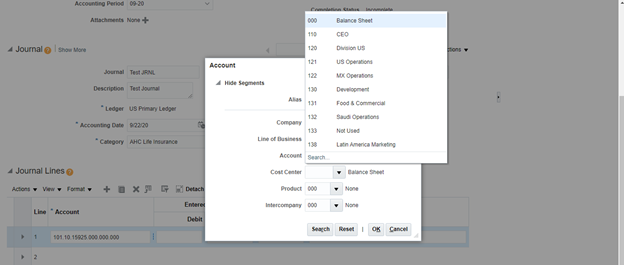
Use the Security Console to assign the appropriate role to the appropriate user. For example, assign the role VIS_General Accountant role to the users who should have access to the cost centers 110 and 120. Login as that user and verify in the Create journal screen.  Only cost centers 110 and 120 are visible as below.


Since, enabling data security on the value set will deny the access to all values for that value set. Which means other users who do not have VIS_General Accountant Role will not be able to access any values of Cost Center Segment.

We can define another similar Policy to provide access to All values of the Value set and assign to a custom role solely created to provide access to all the values of the value set. Use the Security Console to assign this role to the appropriate users who should have access to all the cost centers.

Note: It is not necessary to create a condition for this and we need to select All Values as row set.

Reference links: 

Sunday, August 16, 2020

Creating Custom Infolet and Restricting visibility based on Role

Pre-Requisites:

1.      Access to the Reports and Analytics.

2.      Access to the Subject area on which report needs to be developed.

3.      Access to create and publish the sandbox at site level.

Process:

1.      Create an OTBI Analysis (Graph View) to be displayed on the custom infolet.

2.      Create infolet using sandbox.

3.      Define the infolet visibility (Optional).

4.      Publish the sandbox and verify the results.

Step 1: Create an OTBI Analysis (Graph View) to be displayed on the custom infolet.

Log in to the application and Navigate to Reports and Analytics.

Click on Browse Catalog.

Click on New >> Analysis

Select a Subject area (Say Payables Invoices – Transactions Real Time) based on the requirement.

Drag and drop the required columns on the Selected columns area.

For Example: Let us create a simple analysis report which displays the top 5 AP Invoices created in the current year.

Select columns that are needed:

Invoice Number: Invoice Details >> General Information >> Invoice Number

Invoice Amount: Invoice Details >> Invoice Amounts >> Invoice Amount

Invoice Amount Paid: Invoice Details >> Invoice Amounts >> Invoice Amount Paid

Sort the Invoice Amounts in Descending Order.

Put a filter condition to restrict only the top 5 invoices.

Also, let us add Invoice Creation Date to the report.

Invoice Creation Date: Invoice Details >> General Information >> Invoice Creation Date

Put a filter condition on Invoice creation date to restrict the invoices created in the current year.


We can hide the Invoice creation date column by going to the Column Format tab in column properties.

Go to the Results tab and view the output in Table view (by default). Since we do not need the table view of the reports, we can close those views and add a new view.

Adding a New View: Click on New View button >> Graph >> Bar >> Vertical.

We can also edit in Compound layout and change the look & feel of the graph. Click on Graph Properties to set the canvas size so that it fits in the infolet region.

In the Titles and Labels tab, Uncheck the below-highlighted boxes. This will remove the text under the X and Y-axis.

Review the output in the Results tab and Save the report once finalized.

Step 3: Create infolet using sandbox.

Navigate to Sandboxes under Configuration.

Click on Create Sandbox.

Enter the sandbox name and select the Structure and Page Composer checkboxes. Click on Create and Enter.

Go to the homepage by clicking on Home (🏠)Button.

Go to the Infolets page.

Accessible from the Welcome Springboard (aka your Homepage) through the Navigational Dots/ Train stops (if using the Panel Homepage) or through the Analytics Section.

Click on Edit Page.

Infolets in Panel Homepage:

Click on Create infolet.

Infolets in Analytics Section.

Enter the infolet name and select the dimensions as per the requirement.

We also have a few more options like Back View, Extensive view.

Click on Add Content.

Navigate to the report path:

Ex: Reports and Analytics >> OBIEERepository >> Shared Folders >> Custom >> Infolets


Click on Add.

Click Close.

The graph will be shown in the infolet as below.

Step 3: Define the infolet visibility (Optional)

Click on orange Dropdown button and select Edit Visibility.

By default, it is marked as ‘Yes’. Select ‘EL Expression’. Enter the value as below in Expression builder to restrict based on user roles.

EL Expression Syntax: #{securityContext.userInRole[‘<ROLE_CODE>’]}

Ex: #{securityContext.userInRole[‘<ORA_AP_ACCOUNTS_PAYABLE_MANAGER_JOB>’]}

This implies the infolet is visible only for users having the job role ‘Accounts Payable Manager’.

Click Save and Close.

Click Close.

Step 4: Publish the sandbox and verify the results.

Click on the sandbox name and select Publish.

Click OK.

Click Publish.

Click on Continue to Publish.

The infolet is shown as below.

This completes the creation of custom infolet and restrict visibility based on a user role.